
Maths · P6 · Specimen 03 Maths Questions
· 26 Jun 2026, 12:51
· asked by maxloo
· resolved
SP003 Maths Paper 1 Booklet A – Question 11
The bar graph shows the number of students from three classes, X, Y and Z, who visited the library one day.
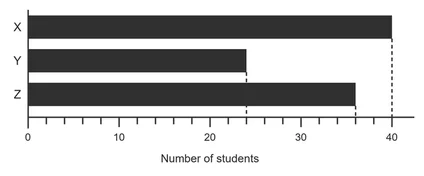
Each class has the same number of students.
All the students in class X visited the library on that day.
What percentage of class Y visited the library?
(1) 24%
(2) 60%
(3) 64%
(4) 76%